
Introducing NLPatent Visualize
NLPatent Visualize turns any search or portfolio into an AI-generated topic map, surfacing white space, competitor clusters, and trends in seconds.
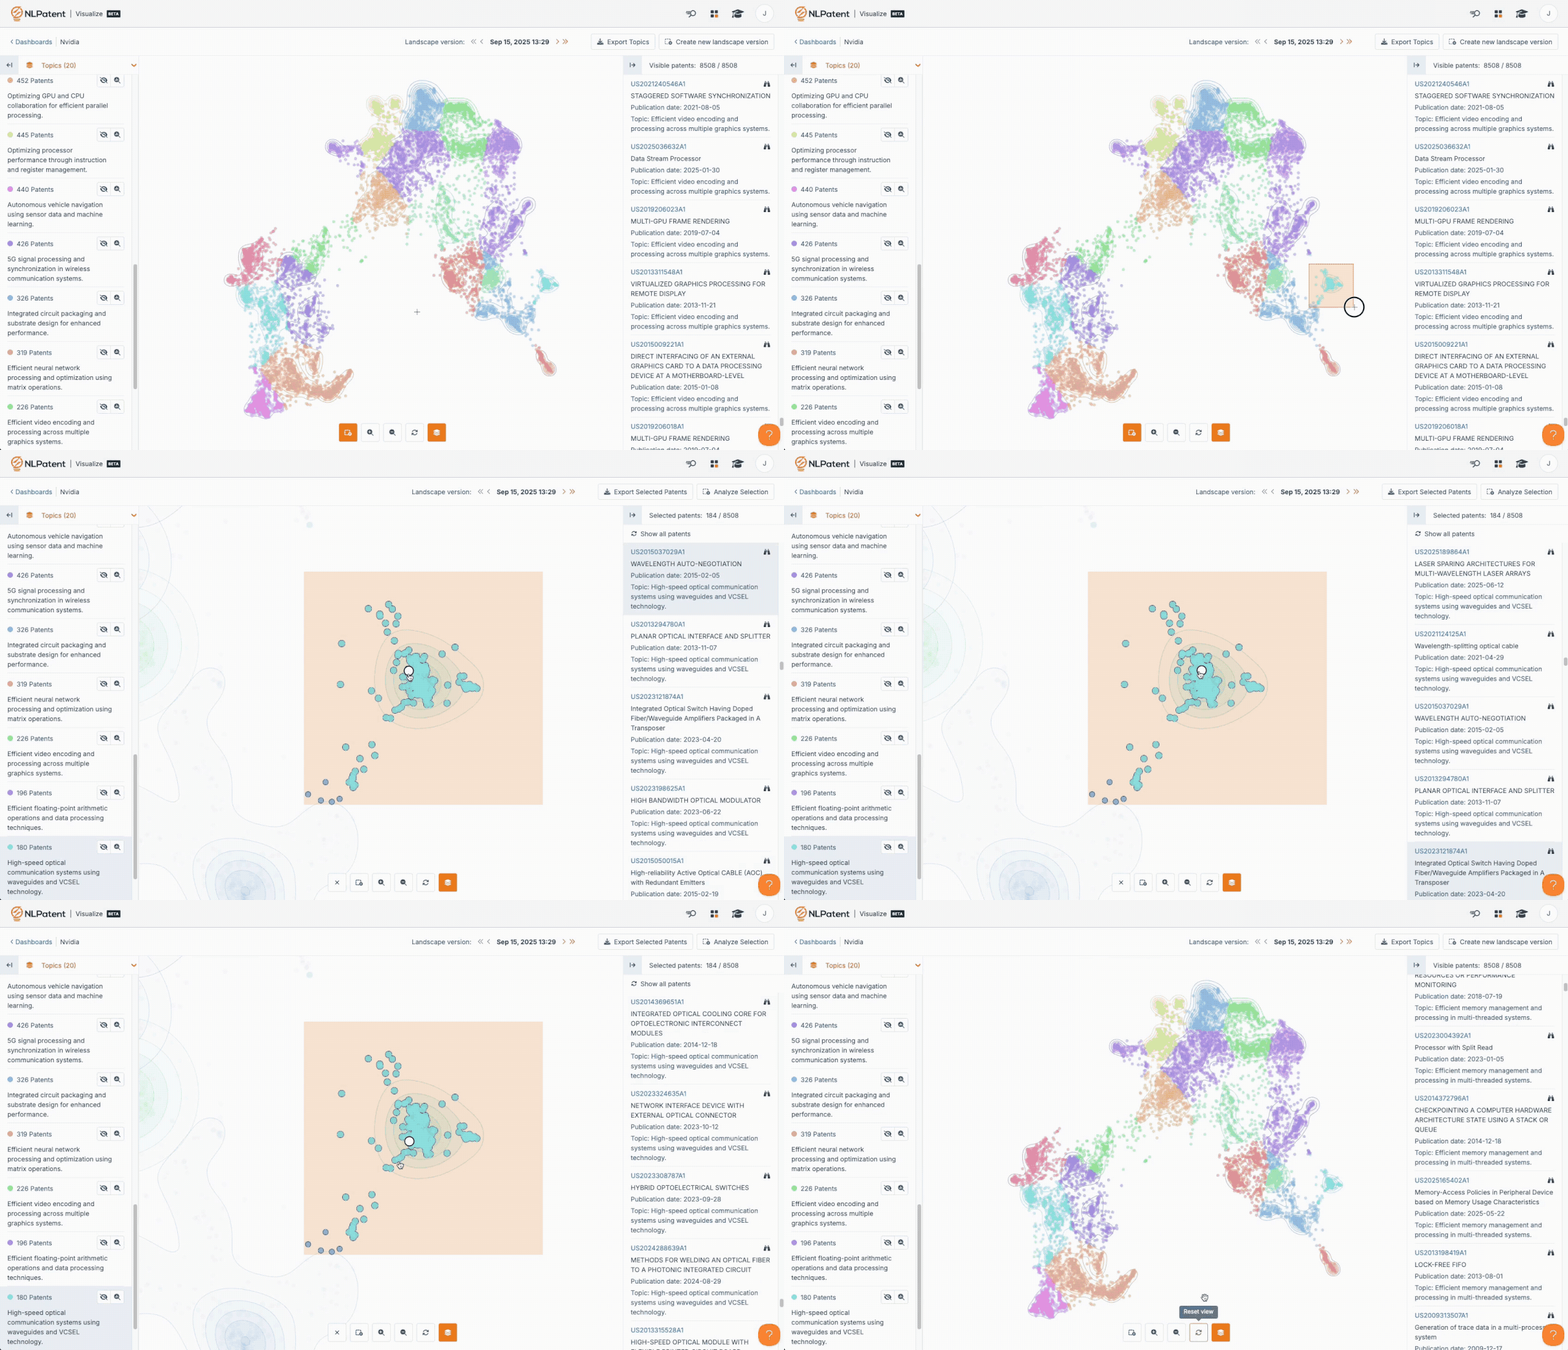
Introducing NLPatent Landscaping with Visualize
Patent research usually involves finding a needle in a haystack - surfacing the most relevant document to a disclosure, patent document, or set of features. But sometimes it requires us to zoom out, allowing us to see the bigger picture. Who’s working on what? Where is the field crowded? What does our patent portfolio actually look like? Where are the gaps that could become opportunities?
Until now, those answers required weeks of manual effort, spreadsheets, and specialized analytics software with rigid custom taxonomies. With NLPatent Visualize, any search project or patent portfolio can be transformed into an AI-generated map of the landscape, giving you flexibility to widen the lens and see each patent document in context.
The Next Step in Patent Research
NLPatent has already changed the game with its precision search and AI-powered “Ask” tools. Now, Visualize takes you one step further: from analyzing patents to understanding patent landscapes.
With Visualize, every patent document becomes more than just a serial number in a spreadsheet. Our patent-specific AI clusters and organizes documents into interactive topic maps so you can move seamlessly from context-level detail to strategy-level insights.
What Makes Visualize Different
Unlike static landscaping tools that require heavy setup, consultants, or manual analysis, NLPatent Visualize is:
- Instant – Any search or list of patents can be visualized with a click, no extra manual steps needed.
- Integrated – Works hand-in-hand with NLPatent’s industry-leading search engine, so your clusters are composed from the most relevant documents from the start.
- Customizable – Export full patent portfolios or lists of patent documents directly to Visualize to analyze large groups of patents and understand trends and technology clusters.
- Explorable – Zoom out for the big picture, dive into clusters for more granular themes, or click straight into the patent documents themselves.
- Strategic – Beyond patents, you can surface assignees, jurisdictions, publication types, and more (all in context of course!).
Why It’s Loved
Visualize isn’t just about pretty charts or maps. It’s about accelerating the insights that matter:
- See where the field is crowded so you can identify potential blockers.
- Spot emerging trends to catch opportunities before competitors.
- Find whitespace and uncover areas ripe for new filings or R&D.
- Map competitors instantly to see who’s active, and where.
This is the kind of insight that used to take weeks of labour and custom analysis and now happens in seconds.
From Search to Strategy
Visualize is a core module in the NLPatent platform, designed to work seamlessly across workflows like Search and Monitor. Whether you’re scanning thousands of patents, tracking competitors, or focusing on a niche technology, Visualize turns raw results into clear strategic insight.
With NLPatent, expertise is amplified, not replaced, empowering patent and R&D professionals with the ability to see more and move faster.
And this is just the beginning.
The Visualize module is evolving rapidly, with new capabilities and deeper analytic tools on the horizon, giving you even more ways to turn patent data into actionable intelligence.
Discover NLPatent today → https://www.nlpatent.com/visualize
Book a demo and see Clerq in action.



Book a demo and see Clerq in action.